# Build a report people can act on
> Reports turn a month of your AI visibility, traffic, search and sales data into a shareable document you build from widgets.
 Use **Reports** to review a defined period and explain what changed, what the evidence supports and what to do next. Start with the reader's decision, then include the relevant information.
A report should distinguish AI answer visibility, website activity, pipeline and available revenue rather than presenting them as one result.
## 1. Choose the report and period
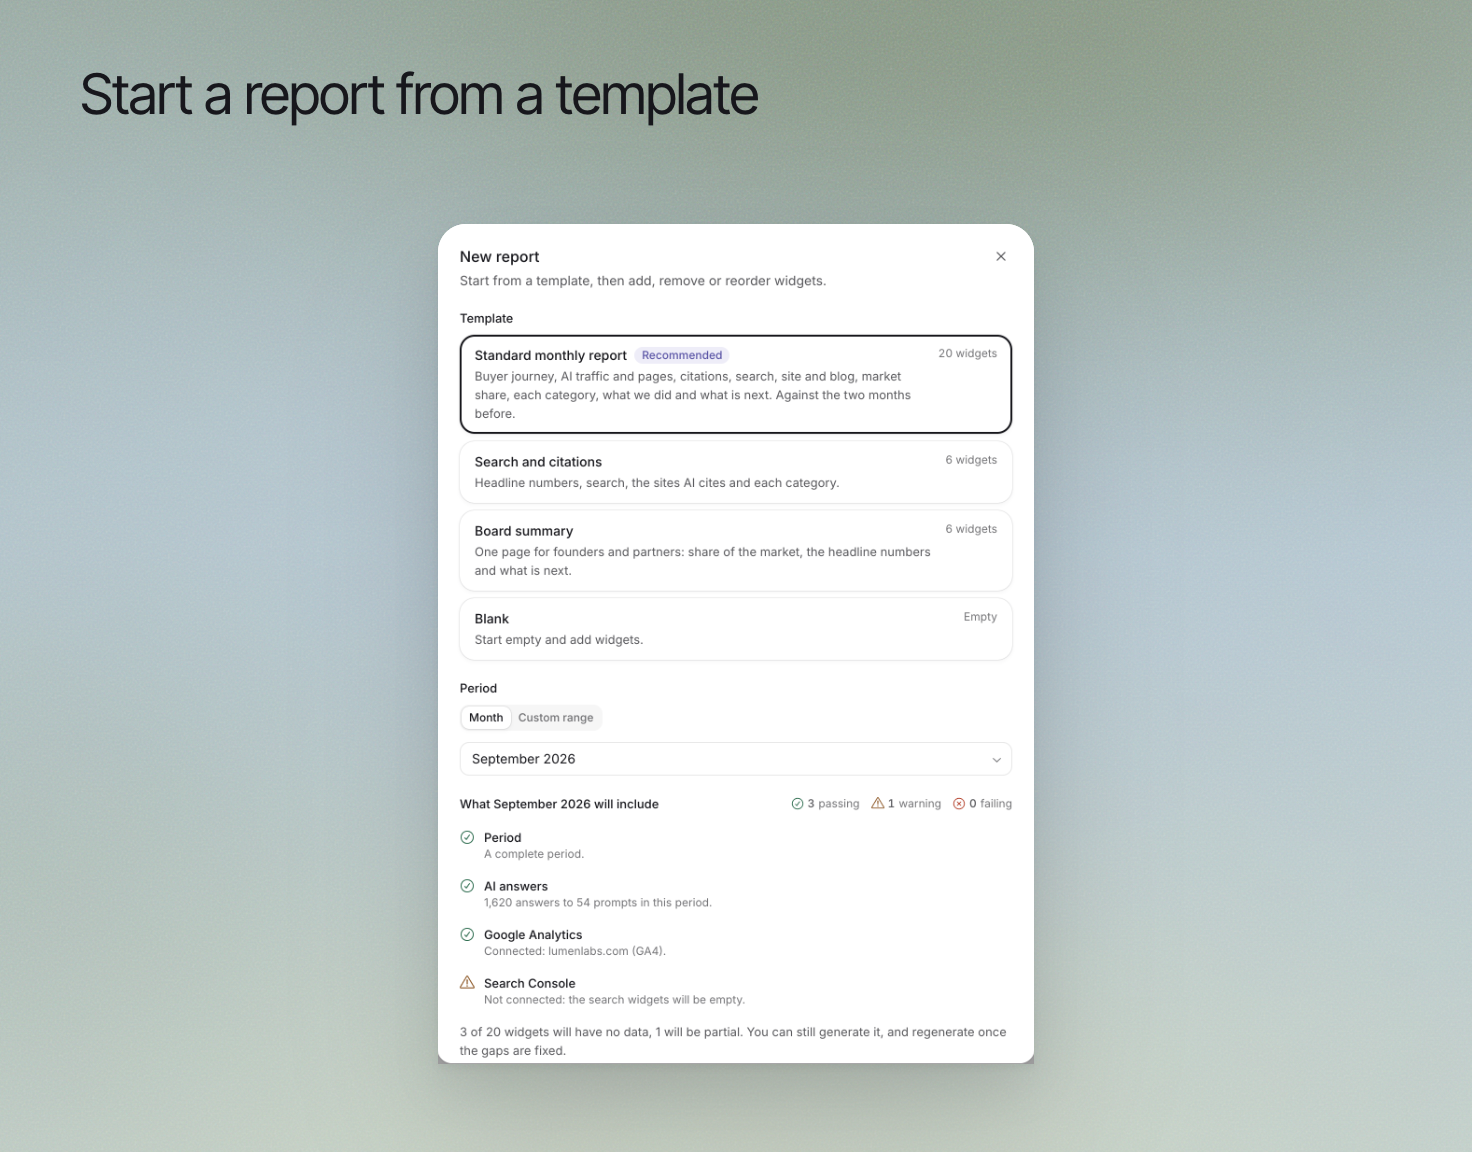
Open **Reports > New report**. Only people with edit access see it; everyone else can read reports. A report needs tracked prompts, so New report stays disabled until the brand has them.
Choose a **Template**: Standard monthly report (marked Recommended), Sales from AI (stores), Search and citations (B2B), Board summary or Blank. Then choose the **Period**: **Month** (the last complete month is the default and the list goes back 13 months) or **Custom range** (up to 93 days). Review the readiness information, then select **Generate report**. With the Standard template and a brand that already has a saved report, the dialog says "Same widgets and order as your October 2026 report. Your own notes and tables stay with that report." Your next Standard report keeps the layout you arranged, and your own widgets stay with the report they were written for. Erlin builds it in about a minute and you can leave the page.
Erlin fills a report from AI visibility prompts, Google Analytics and Search Console. A missing source never blocks the report. Widgets that need it show as having no data, and you can regenerate after you [connect Google Analytics](https://www.erlin.ai/docs/integrations/google-analytics) or [Search Console](https://www.erlin.ai/docs/integrations/google-search-console). A report with no data for a metric should not describe that metric as zero.
## 2. Review the structure
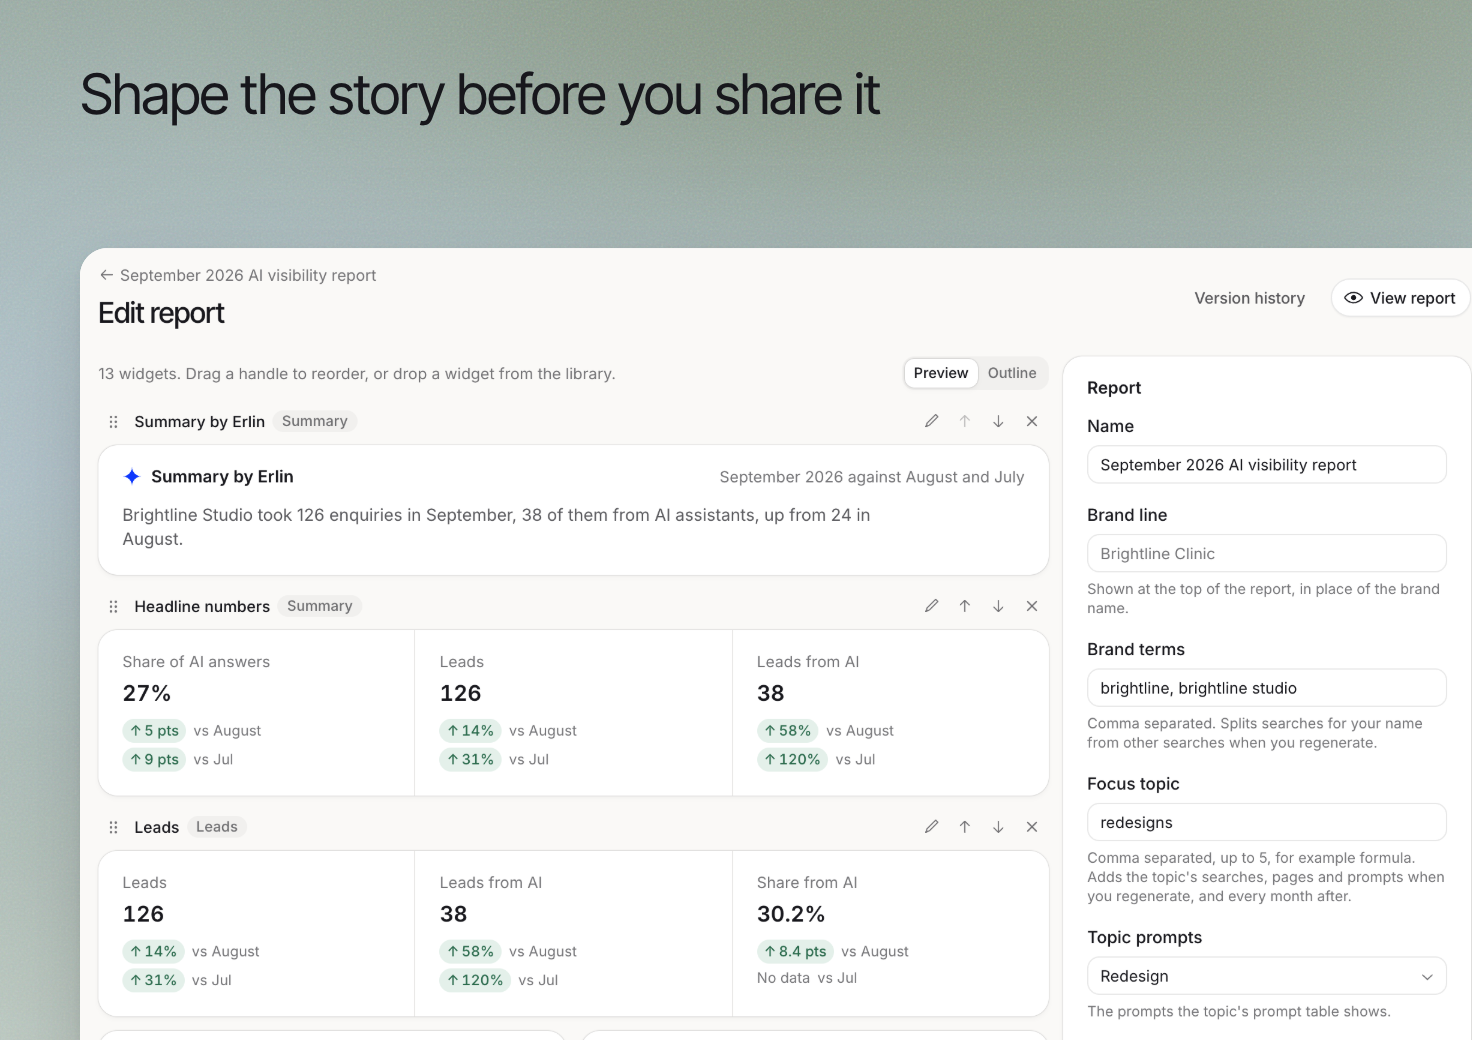
Use **Edit report** to review the report's sections. Switch between **Preview** and **Outline** to inspect its reading order. Search the Widgets library and select **Add** or drag a widget onto the report, drag a handle or use the arrows to reorder, use the pencil to edit a title and text, and the cross to remove one. A report holds up to 40 widgets and each data widget can appear once. Your own widgets are Notes, Highlights (up to six numbers) and Table (up to 50 rows and 8 columns). They are for this report only: next month's report does not copy them. Select **Save report** when you finish; **Discard** drops your changes.
Lead with the main result, explain the relevant change and end with specific next actions. Avoid filling a report with every available chart.
## 3. Check facts and interpretation
Review **Name**, **Brand line**, **Brand terms** and **Focus topic** where relevant. **Brand terms** (up to 40, comma separated) split searches for your name from other searches. **Focus topic** takes up to 5 words and adds the topic's searches, pages and prompts. **Compare with** is **Last month**, **Last two months** or **Last month and last year**. Every number compares with that earlier period. With **Last month and last year**, every number compares with the month before and the same month last year, and last year's column carries its year, for example "Sept 2025". For a custom range, the second comparison is the same dates a year earlier. Search Console keeps about 16 months of data, so for an older period Erlin leaves the last-year column out. The top searches and pages tables compare with last month only. Brand terms, focus topic and Compare with apply when you regenerate. Ensure the report describes the intended brand and subject.
Erlin can connect lead journeys across days and channels and link won-deal revenue when available. It does not currently connect journeys across devices. Open pipeline is potential value, not realized sales.
 ## 4. Split search into branded and non-branded
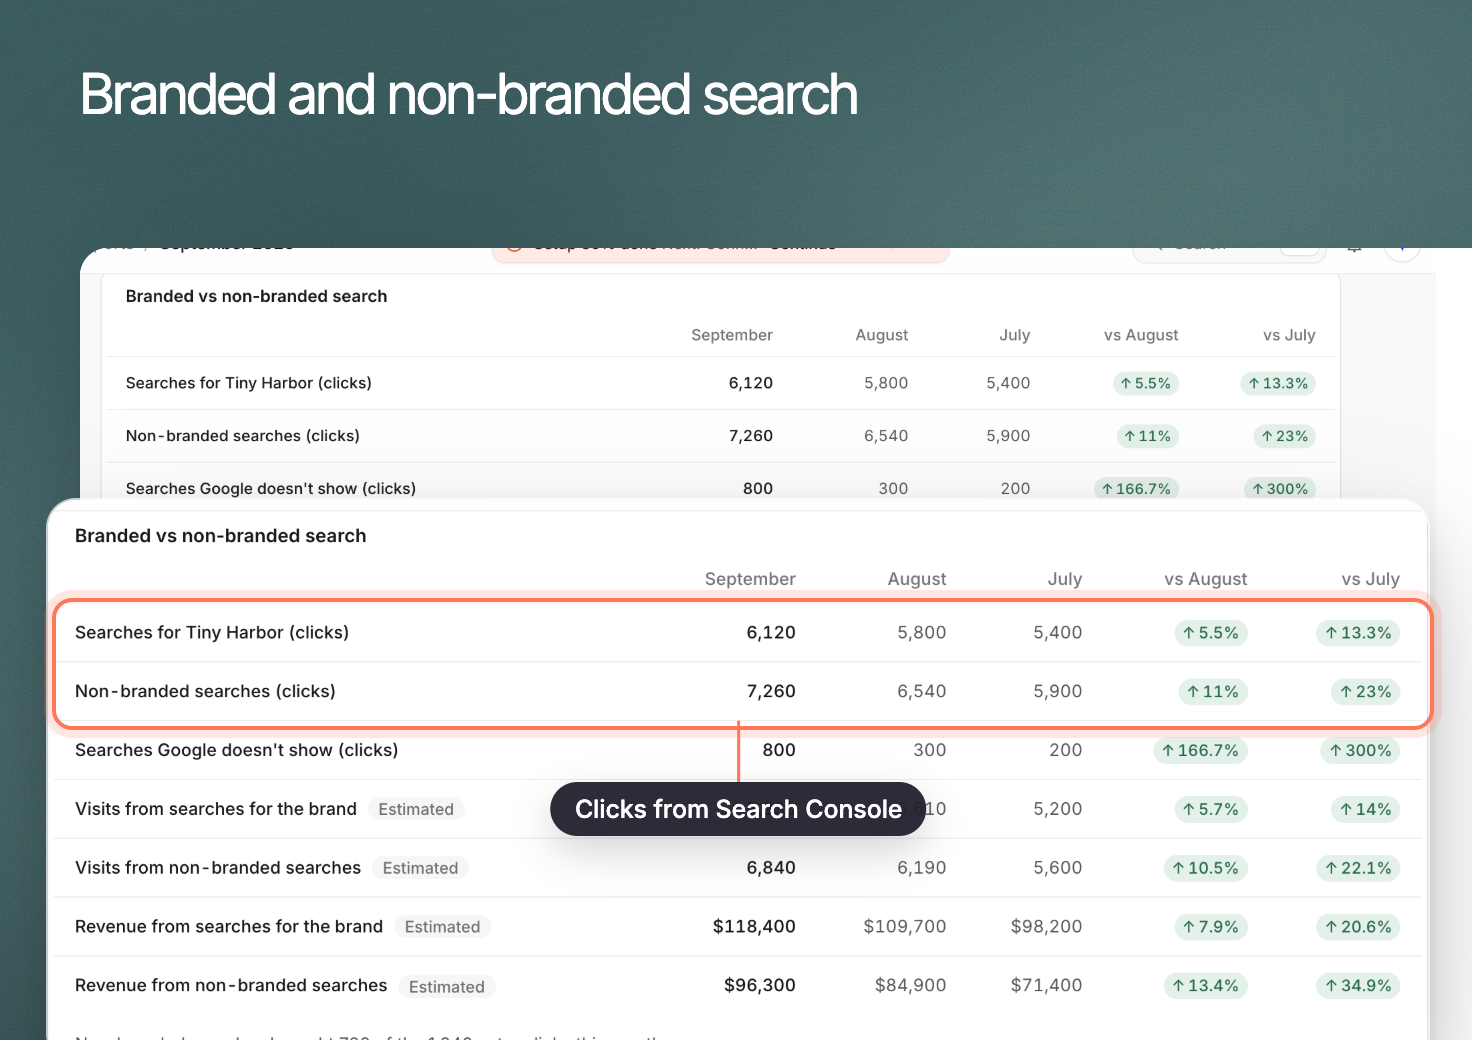 Erlin splits your Google search results into searches that name your brand (branded) and every other search (non-branded), so you can see how much growth comes from people who did not already know you. Two widgets do this: **Branded vs non-branded search** and **Top branded and non-branded searches and pages**. Both are in the Widgets library under **Search**, and the Standard monthly report includes them after the Search widget. A report made before they existed gets them once when you regenerate it, switched off if it has a share link on.
They depend on **Brand terms**. Add the words people use when they search for you in **Edit report**, then regenerate. Without brand terms, the widget says to add brand terms in Edit report. A spelling Erlin does not know, such as "i restore" for iRestore, counts as non-branded until you add it.
**Branded vs non-branded search** has these rows, each compared with the earlier period:
- **Searches for** your brand **(clicks)** and **Non-branded searches (clicks)**, measured in Search Console.
- **Searches Google doesn't show (clicks)**: your total clicks minus the two above. Search Console hides rare searches, so Erlin shows the gap instead of guessing.
- **Visits from searches for the brand** and **Visits from non-branded searches**, tagged **Estimated**.
- **Revenue from searches for the brand** and **Revenue from non-branded searches**, tagged **Estimated**. These appear for stores with revenue.
- **Visits to pages Search Console has no clicks for** and **Revenue on pages Search Console has no clicks for**: not estimated, so the lines add up.
A sentence under the table says where the change in clicks came from, for example "Non-branded searches brought 120 of the 300 extra clicks this month." Only Google searches are included, so the numbers do not match the "Organic search and AI" tile, which also counts other engines and AI.
The note **How it's calculated** reads:
> Clicks come straight from Search Console. Google Analytics doesn't record which search a visit came from, so visits and revenue from each kind of search are estimated: for each landing page, its share of branded and non-branded Search Console clicks is applied to that page's Google organic visits and revenue in Google Analytics. For example, if 80% of a page's clicks came from searches for the brand, 80% of its revenue counts as branded. Added up with the revenue on pages Search Console has no clicks for, the revenue lines match Google organic revenue in Google Analytics; only the split is estimated. Google searches only.
Without sales data the note says "visits" instead of "visits and revenue". A page with no Search Console clicks that month is never guessed into a segment.
**Top branded and non-branded searches and pages** lists the top 10 **Searches for the brand** and the top 10 **Non-branded searches**, each with clicks, the change from last month and click-through rate. **Top pages from non-branded searches** lists the 10 pages with the most non-branded clicks, with last month's clicks, the **Difference** and the **Non-branded share**: of the page's Google search clicks, the part from searches that don't name the brand. Reports built before the pages table existed leave it out.
If Google Analytics is not connected, the clicks still show and the estimated rows say "Connect Google Analytics to estimate visits and revenue from each kind of search." If no property matches, Google Analytics access expired, or Google did not answer while the report was built, the rows say so and you can regenerate. A shared link carries both widgets. A link that hides sales shows no revenue rows, and your brand terms stay private.
## 5. Follow your focus topic
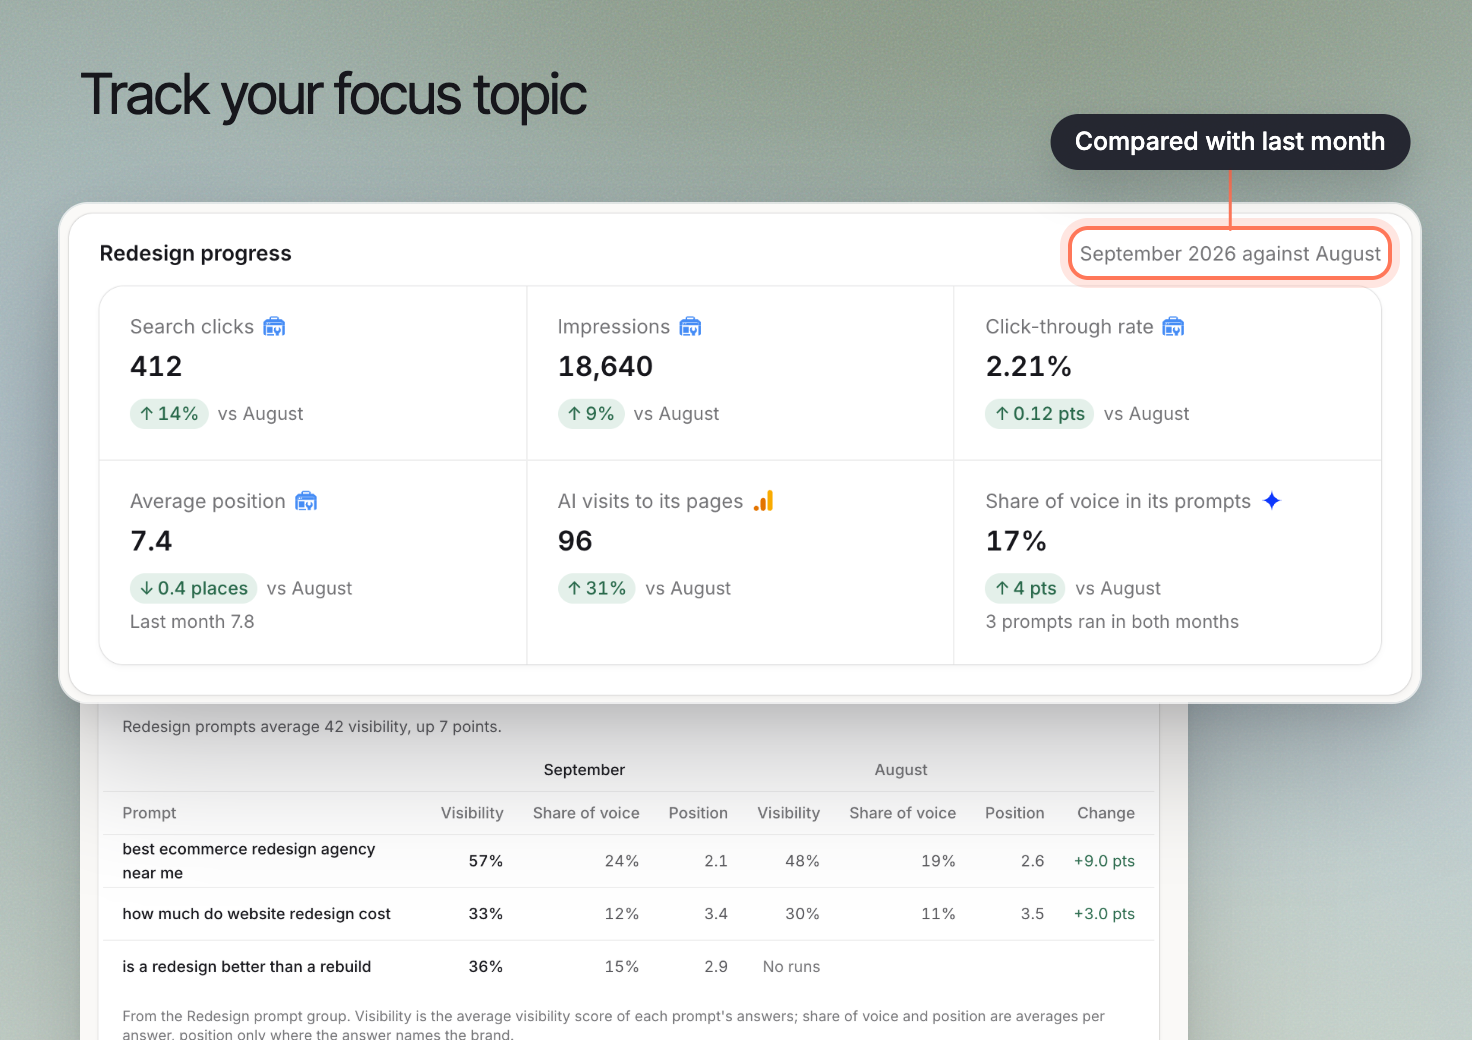 When your brand has a **Focus topic**, the Widgets library offers **Focus topic progress** under **Search**. It shows your focus topic against last month in one place: search clicks, impressions and position, AI visits to its pages, and its prompts in AI answers. Each tile has a change chip, "vs" the earlier period, and the source it came from. A position that moves down the page reads as good, because a lower number is a better place. A brand with no focus topic does not see the widget.
A report built before the widget existed says it was built before Focus topic progress. Click **Regenerate** to include it.
## 6. Review before sharing
Read the final report as someone who did not build it. State important data gaps beside the affected result, and check the audience before sharing.
- **Versions.** Every generate, save, regenerate and restore creates a version, listed under Version history. **Regenerate with latest data** rebuilds the numbers and keeps your widgets and text. **Restore** brings back an earlier version's widgets and text as a new version, with the numbers from the latest data.
- **Share link.** Select the link icon to create a public link that opens without signing in. When you create a share link and your brand has no share password yet, an owner sets one first. Every share link of that brand then asks for it. An owner can change it later, and anyone who opened a link is asked for the new one. Send the password apart from the link. Choose **Stop sharing** to turn it off, and the old link stops working.
- **Download PDF.** Select the download icon. Shared links have a PDF download too.
- **Delete report** removes the report and stops its share link.
Use [AI Visibility](https://www.erlin.ai/docs/ai-visibility/overview) to investigate answer changes, [Analytics](https://www.erlin.ai/docs/leads/analytics) for lead outcomes and [How Erlin works](https://www.erlin.ai/docs/get-started/how-erlin-works) for measurement limits.