# Understand share of voice
> Share of voice is how big a slice of the brands AI lists is your brand: on the Overview tile, your share of each answer's list, averaged over every answer.
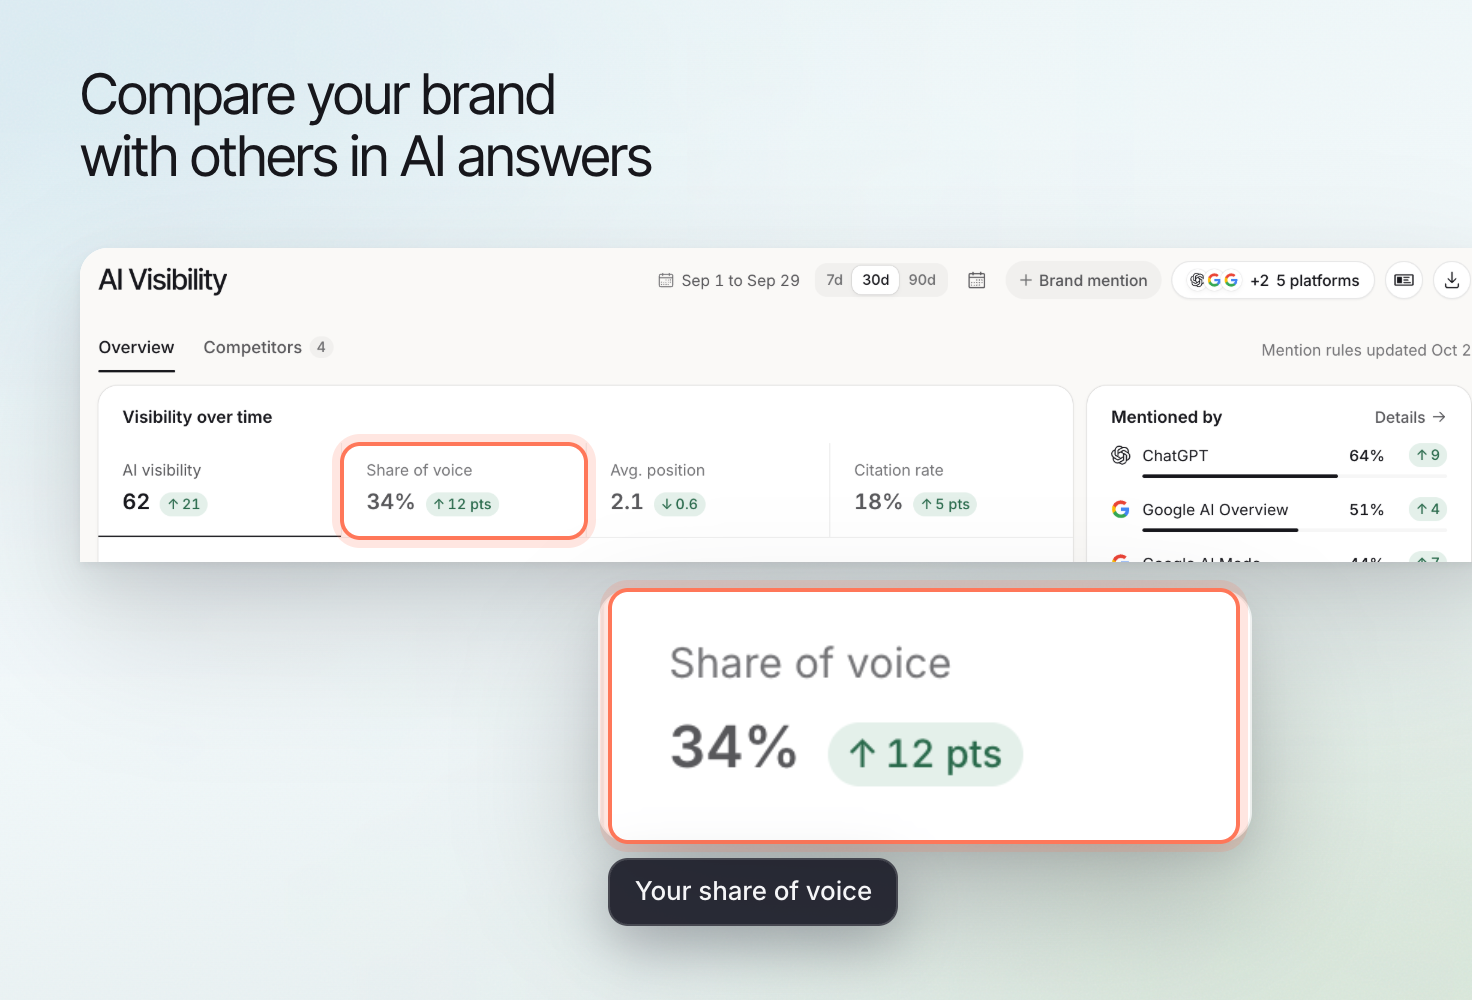 Share of voice compares your brand’s presence with other brands named in collected answers. Use it to investigate the competitive picture within your tracked questions.
## How Erlin calculates it
The **Share of voice** tile averages answer by answer. For every answer, Erlin divides the products or brands it lists that are yours by all the products or brands it lists. An answer that does not name you, or lists nothing, counts as 0%.
```
Share of voice = average of (your products listed ÷ all products listed) × 100, over every answer
```
**Worked example:** Acme has 4 answers listing 5, 2, 4 and 3 products, of which Acme has 1, 1, 0 and 0. The shares are 20%, 50%, 0% and 0%: (20 + 50 + 0 + 0) ÷ 4 = **17.5%**, shown as 18%.
**Who AI recommends** and the Competitors tab use a pooled share instead: a brand's mentions in all answers divided by all brand mentions, so brands plus Other add up to 100%. In the same example, 14 products are listed in all and Acme is 2 of them: 2 ÷ 14 × 100 = **14.3%**. The two differ because the tile gives every answer equal weight, while the pooled share gives every mention equal weight.
## Read the metric in context
Open **AI Visibility > Overview** and find **Share of voice** in **Visibility over time**. Select the reporting period and review the prompt scope before comparing results.
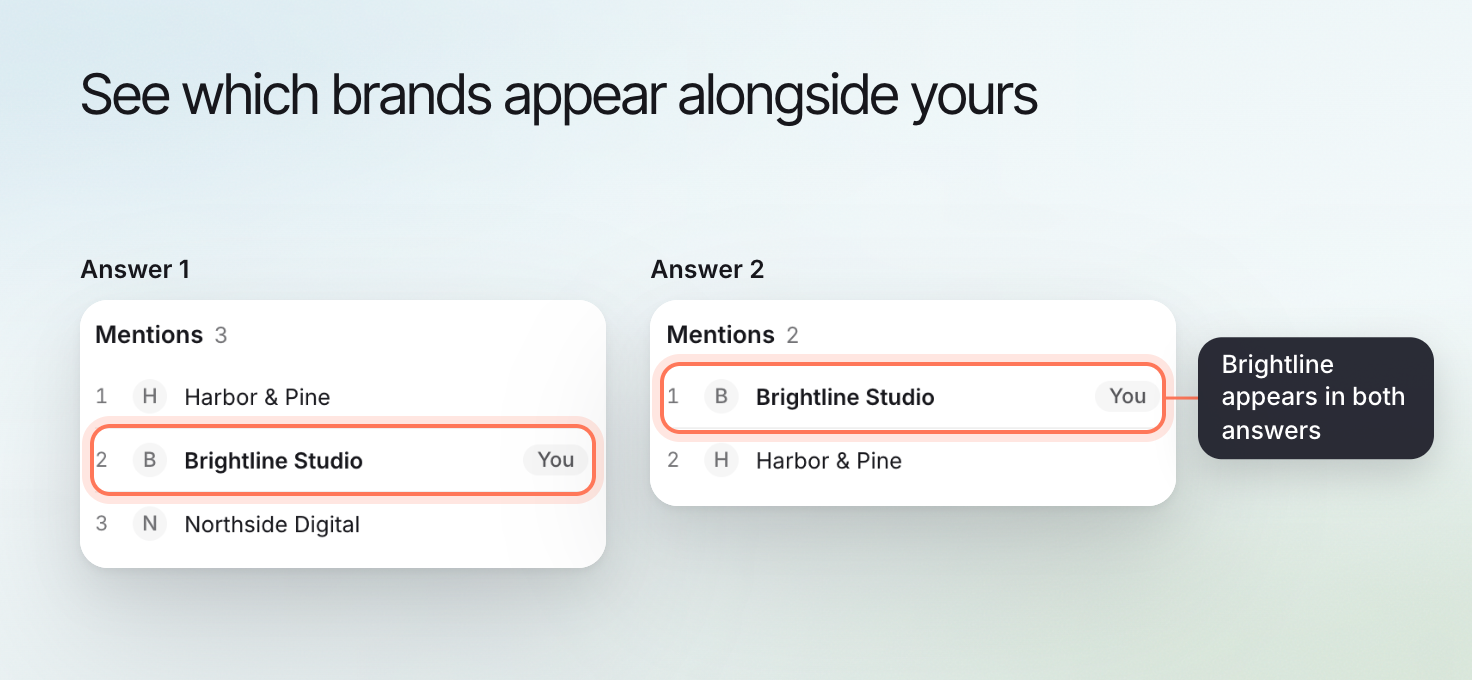
An answer can mention several businesses. Your visibility can stay similar while the balance of named competitors changes. Share of voice is not a measurement of buyer attention or market revenue.
## Check the answers behind the number
Open a relevant prompt in [Prompt details](https://www.erlin.ai/docs/ai-visibility/prompts/prompt-details). Review its platform, answer and sources. Compare like-for-like questions before attributing a movement to a content change.
Check the same view when comparing periods. A summary tile and a competitor distribution can use different aggregation; do not combine their values into a new calculation.
Share of voice compares your brand’s presence with other brands named in collected answers. Use it to investigate the competitive picture within your tracked questions.
## How Erlin calculates it
The **Share of voice** tile averages answer by answer. For every answer, Erlin divides the products or brands it lists that are yours by all the products or brands it lists. An answer that does not name you, or lists nothing, counts as 0%.
```
Share of voice = average of (your products listed ÷ all products listed) × 100, over every answer
```
**Worked example:** Acme has 4 answers listing 5, 2, 4 and 3 products, of which Acme has 1, 1, 0 and 0. The shares are 20%, 50%, 0% and 0%: (20 + 50 + 0 + 0) ÷ 4 = **17.5%**, shown as 18%.
**Who AI recommends** and the Competitors tab use a pooled share instead: a brand's mentions in all answers divided by all brand mentions, so brands plus Other add up to 100%. In the same example, 14 products are listed in all and Acme is 2 of them: 2 ÷ 14 × 100 = **14.3%**. The two differ because the tile gives every answer equal weight, while the pooled share gives every mention equal weight.
## Read the metric in context
Open **AI Visibility > Overview** and find **Share of voice** in **Visibility over time**. Select the reporting period and review the prompt scope before comparing results.
An answer can mention several businesses. Your visibility can stay similar while the balance of named competitors changes. Share of voice is not a measurement of buyer attention or market revenue.
## Check the answers behind the number
Open a relevant prompt in [Prompt details](https://www.erlin.ai/docs/ai-visibility/prompts/prompt-details). Review its platform, answer and sources. Compare like-for-like questions before attributing a movement to a content change.
Check the same view when comparing periods. A summary tile and a competitor distribution can use different aggregation; do not combine their values into a new calculation.
 ## Avoid misleading comparisons
Changing the prompt set, platforms or the locations prompts run from changes the evidence being summarized. Keep a record of those changes. A period with missing answers should not be treated as equivalent to a complete set of checks.
Prompt Discovery volume is an estimate of demand. It is separate from the answers used to assess visibility, and neither number is a count of website visitors.
## Decide what to investigate next
Review [competitor gaps](https://www.erlin.ai/docs/ai-visibility/competitors) and [cited sources](https://www.erlin.ai/docs/ai-visibility/citations/overview) to find the specific page or question behind a change. Use [Brand mention rules](https://www.erlin.ai/docs/ai-visibility/brand-mentions) for recognition errors, and [recommendations](https://www.erlin.ai/docs/opportunities/opportunity-and-action) for possible next actions.
See [How Erlin works](https://www.erlin.ai/docs/get-started/how-erlin-works) for the measurement boundaries. A stronger metric is evidence about tracked answers, not a guaranteed business outcome.
## Avoid misleading comparisons
Changing the prompt set, platforms or the locations prompts run from changes the evidence being summarized. Keep a record of those changes. A period with missing answers should not be treated as equivalent to a complete set of checks.
Prompt Discovery volume is an estimate of demand. It is separate from the answers used to assess visibility, and neither number is a count of website visitors.
## Decide what to investigate next
Review [competitor gaps](https://www.erlin.ai/docs/ai-visibility/competitors) and [cited sources](https://www.erlin.ai/docs/ai-visibility/citations/overview) to find the specific page or question behind a change. Use [Brand mention rules](https://www.erlin.ai/docs/ai-visibility/brand-mentions) for recognition errors, and [recommendations](https://www.erlin.ai/docs/opportunities/opportunity-and-action) for possible next actions.
See [How Erlin works](https://www.erlin.ai/docs/get-started/how-erlin-works) for the measurement boundaries. A stronger metric is evidence about tracked answers, not a guaranteed business outcome.